Turning operational data into a workspace people can act on.
A management information portal designed around reporting, analytics, records, and operational workflows across consumers, beneficiaries, vendors, and financial institutions.

Make a lot of information feel navigable.
The portal brings together several operational domains that naturally produce dense information: consumers, beneficiaries, vendors, financial institutions, analytics, and downloadable data.
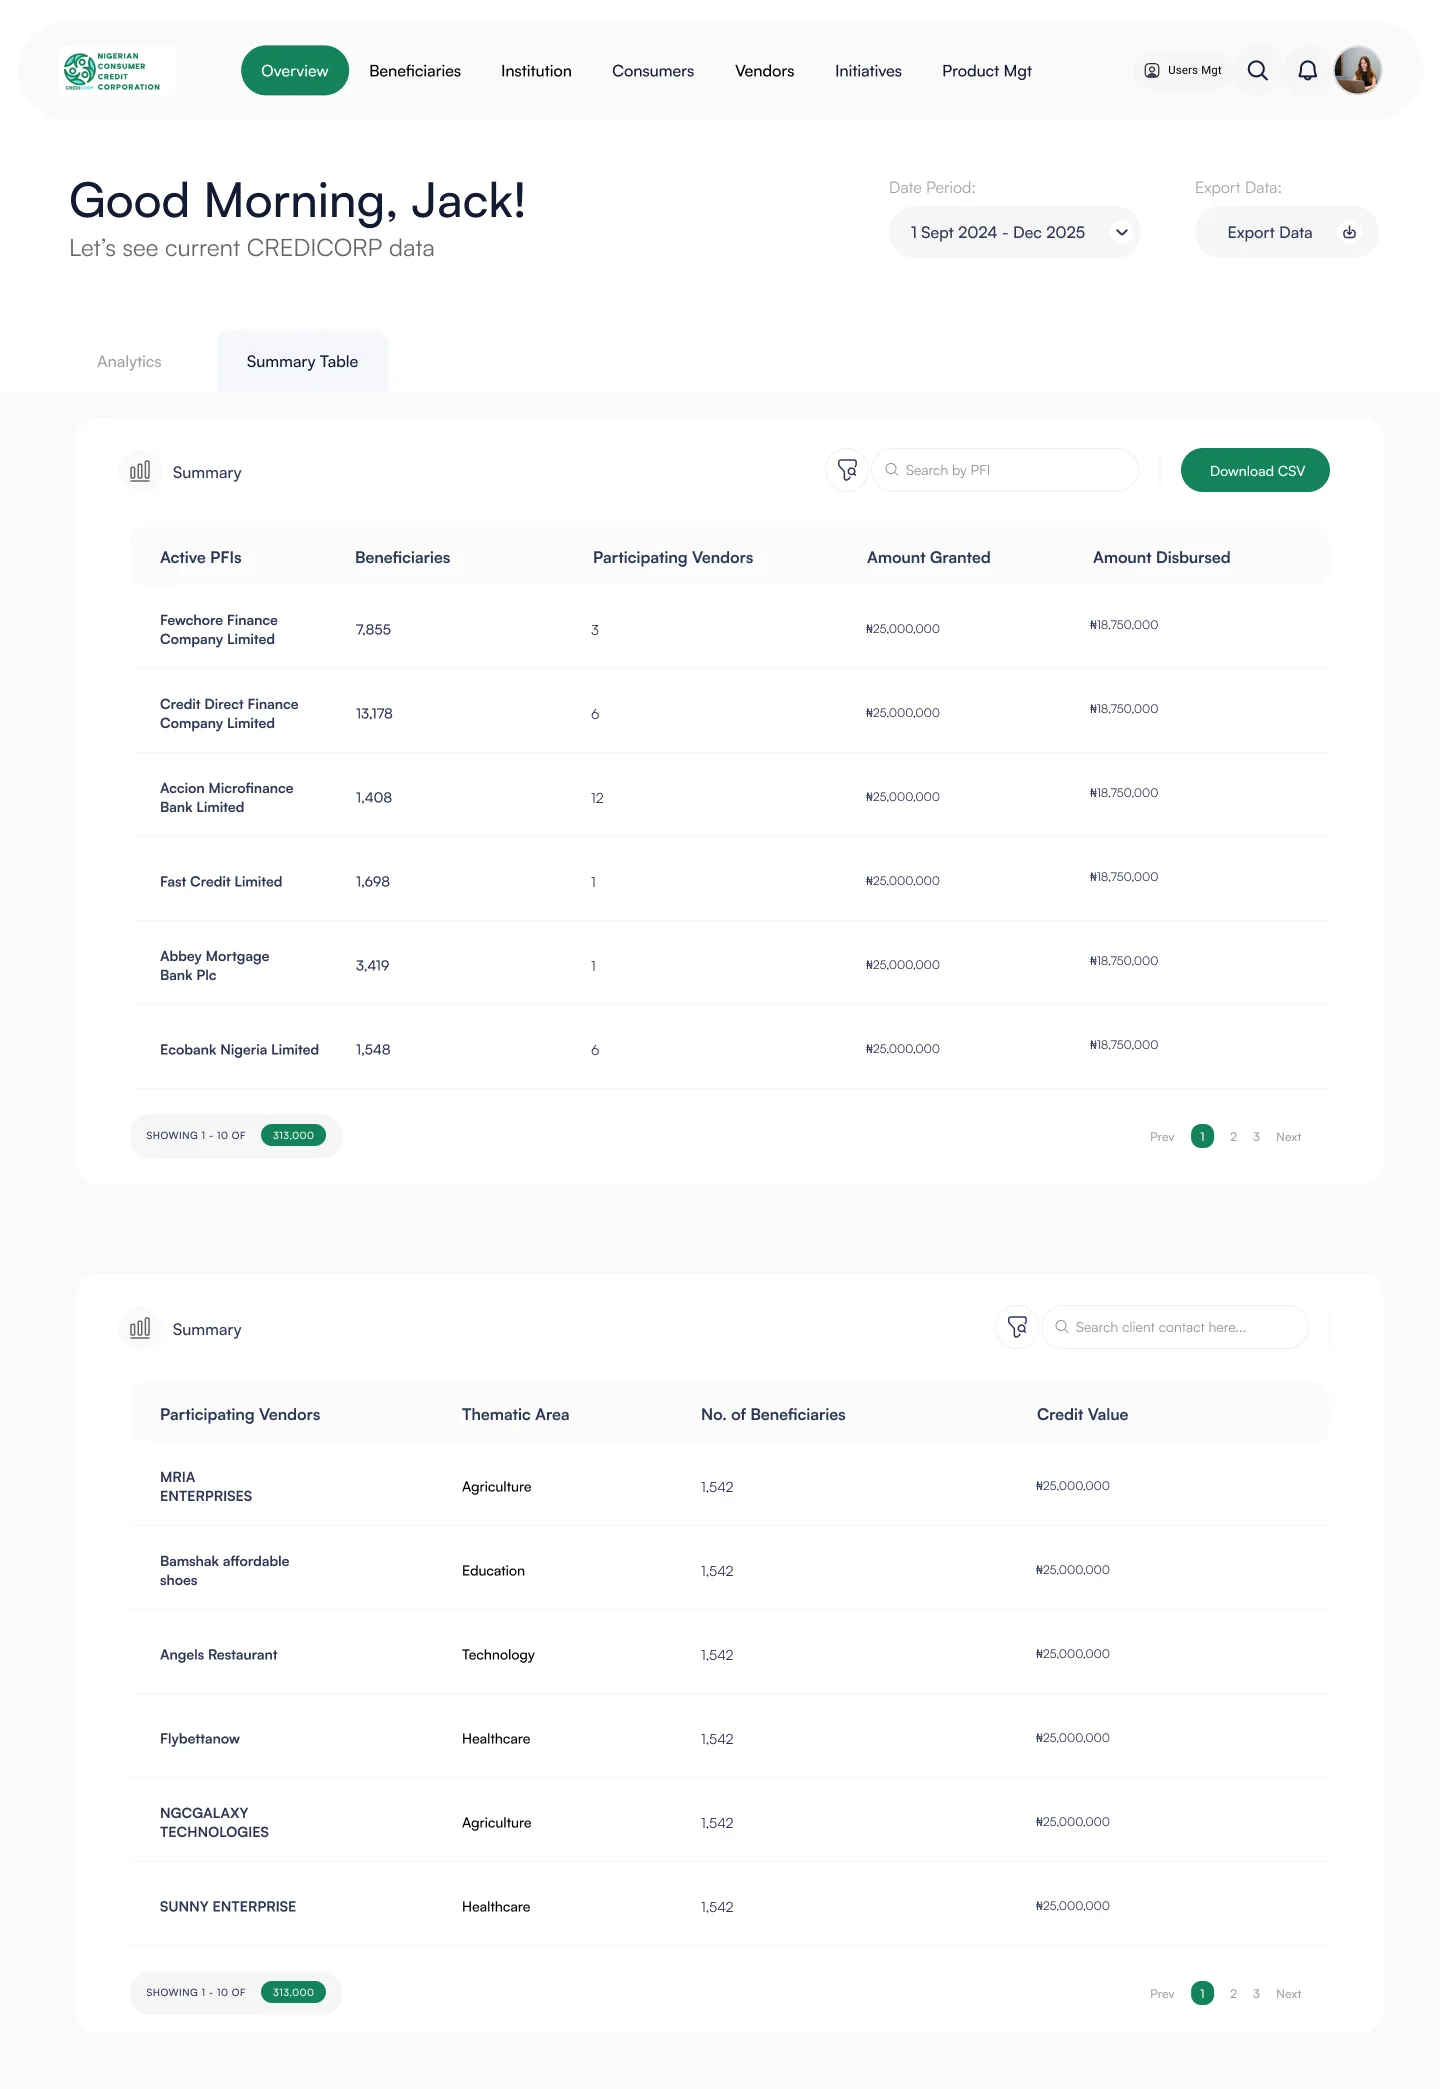
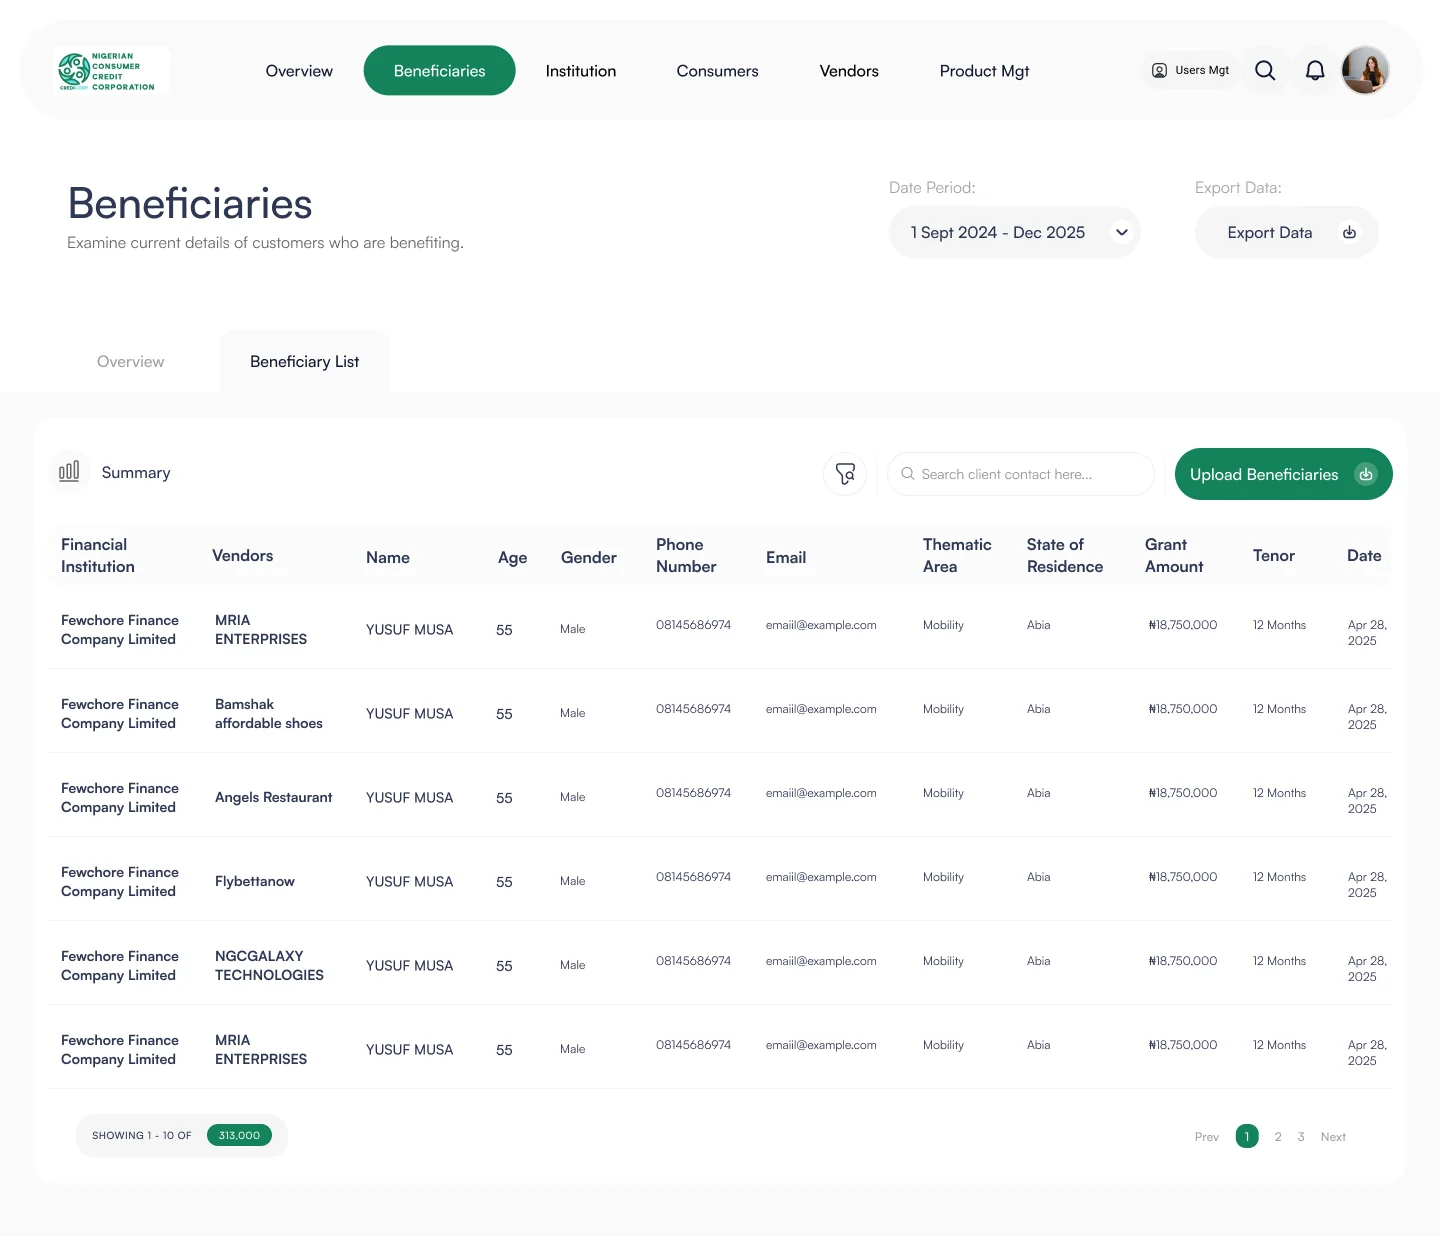
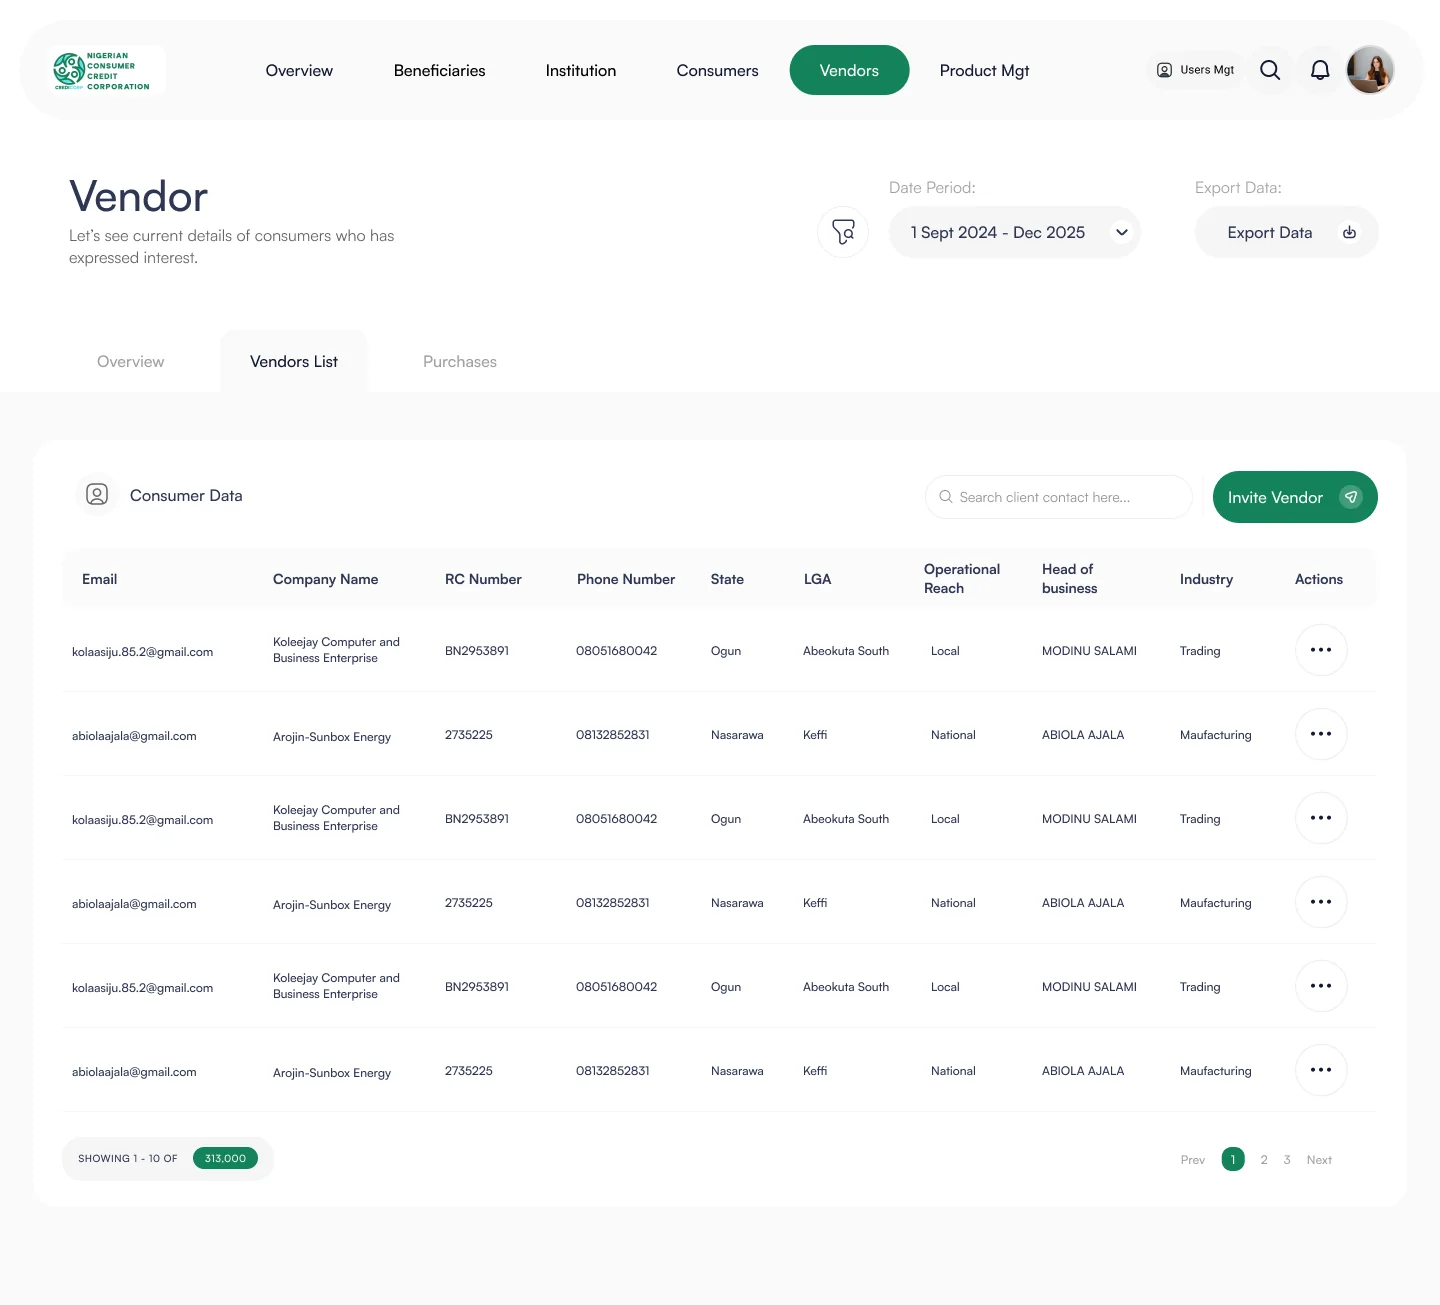
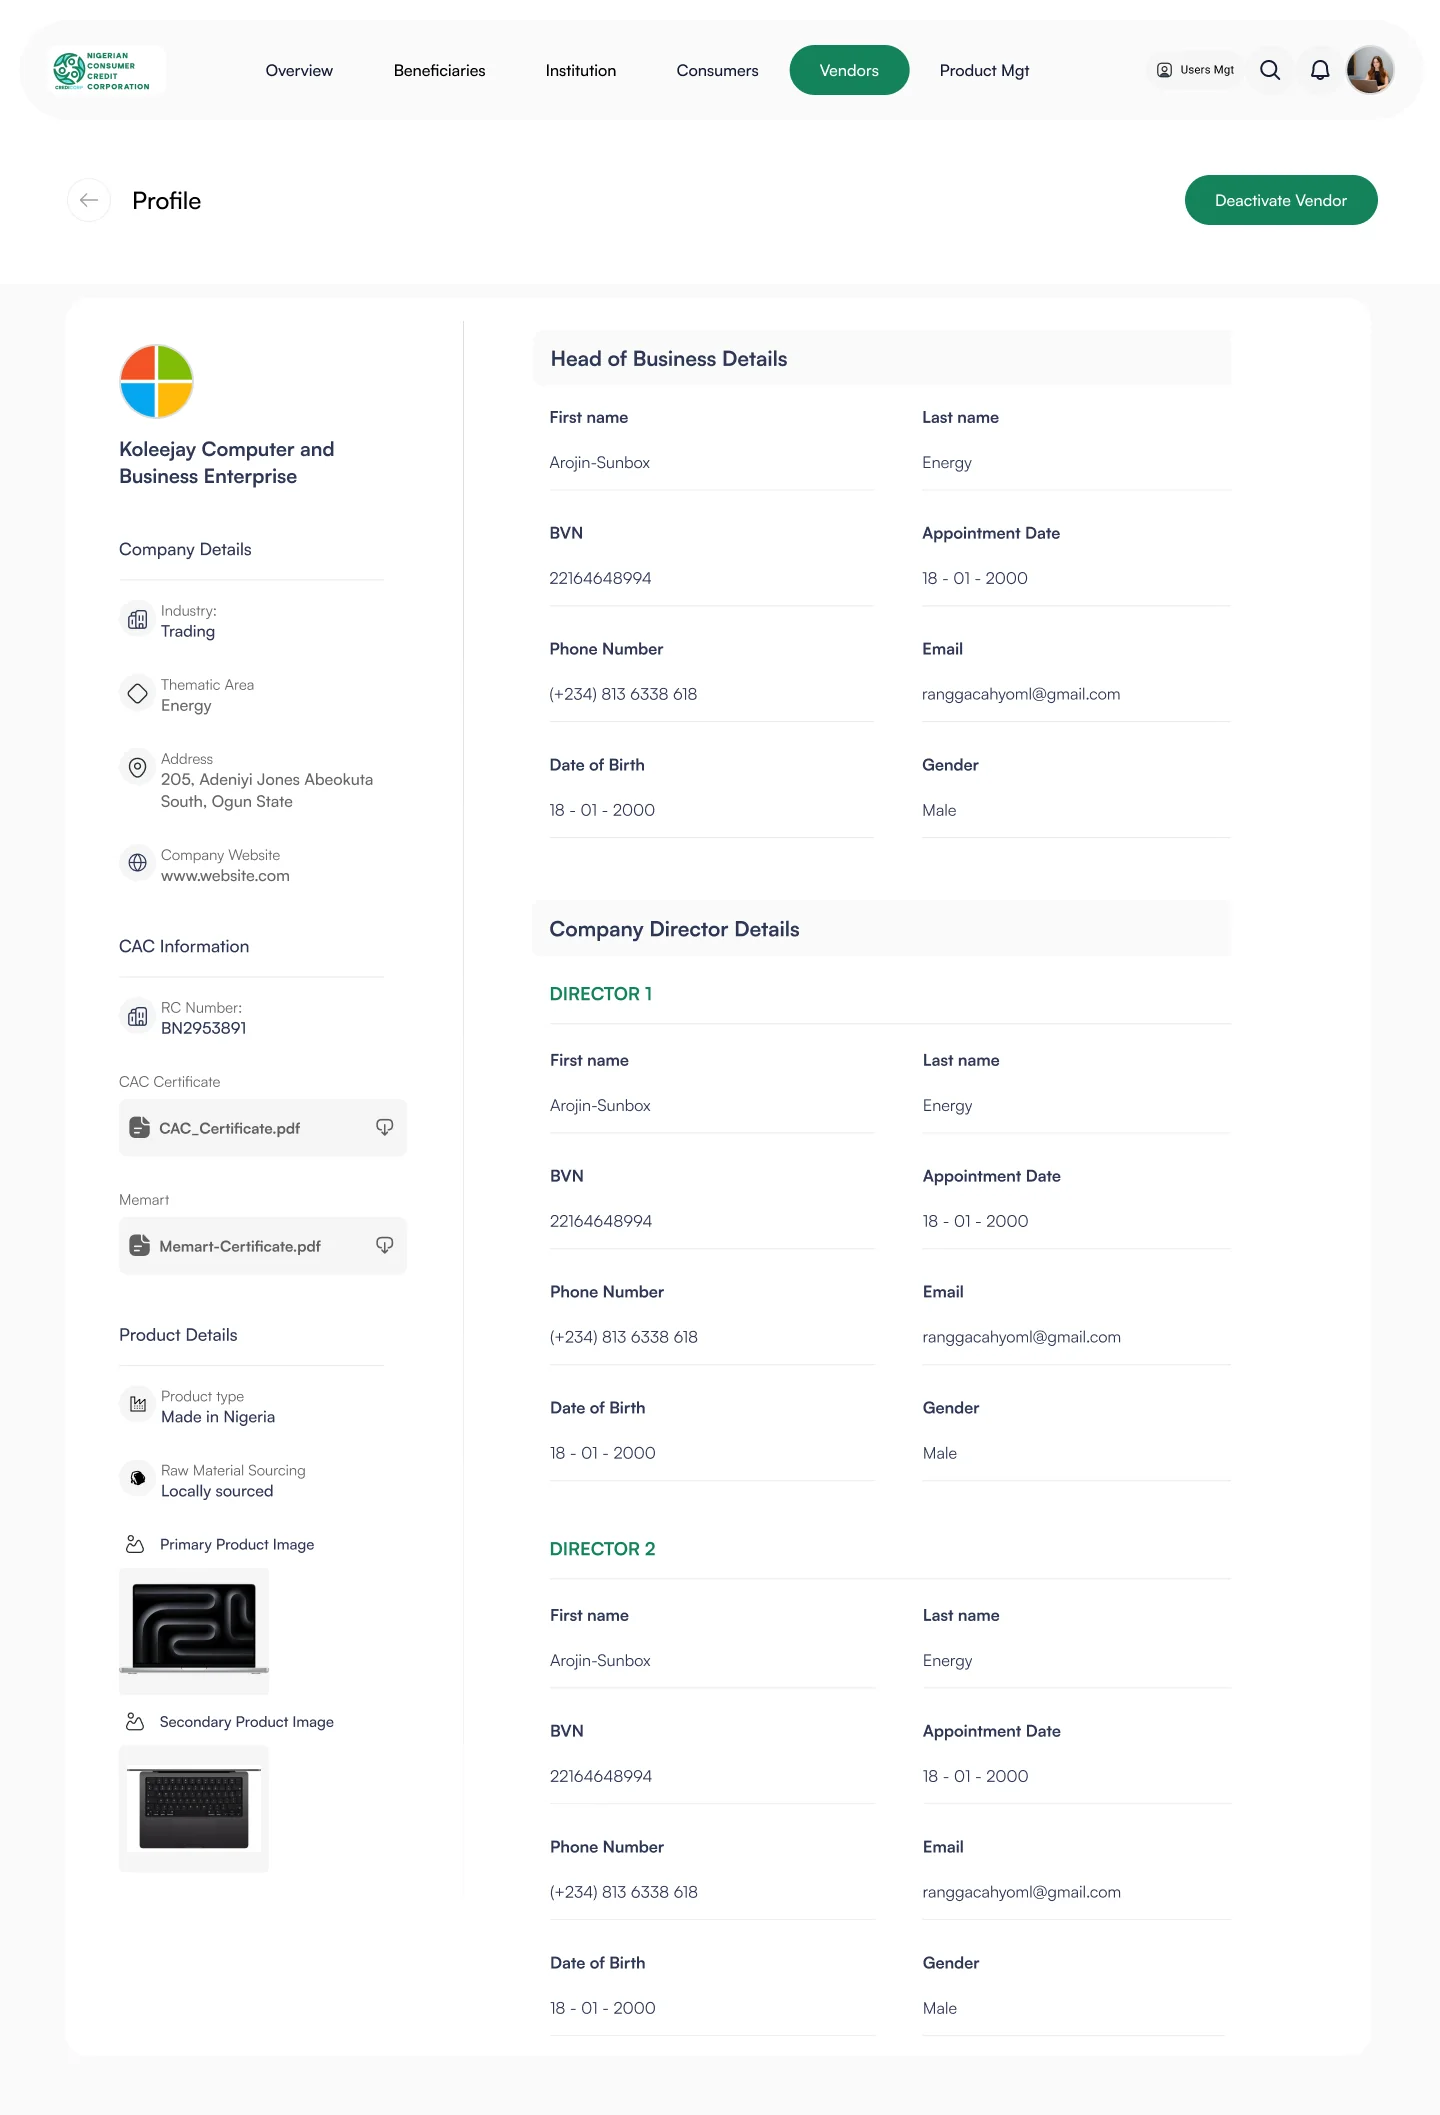
The UX challenge is visible in the screens: users need to move between high-level summaries and detailed records without losing context. Tables need to support scanning; analytics need to support interpretation; profiles need to expose enough detail without becoming overwhelming.
One system, several ways of working.
Design the hierarchy before decorating the data.
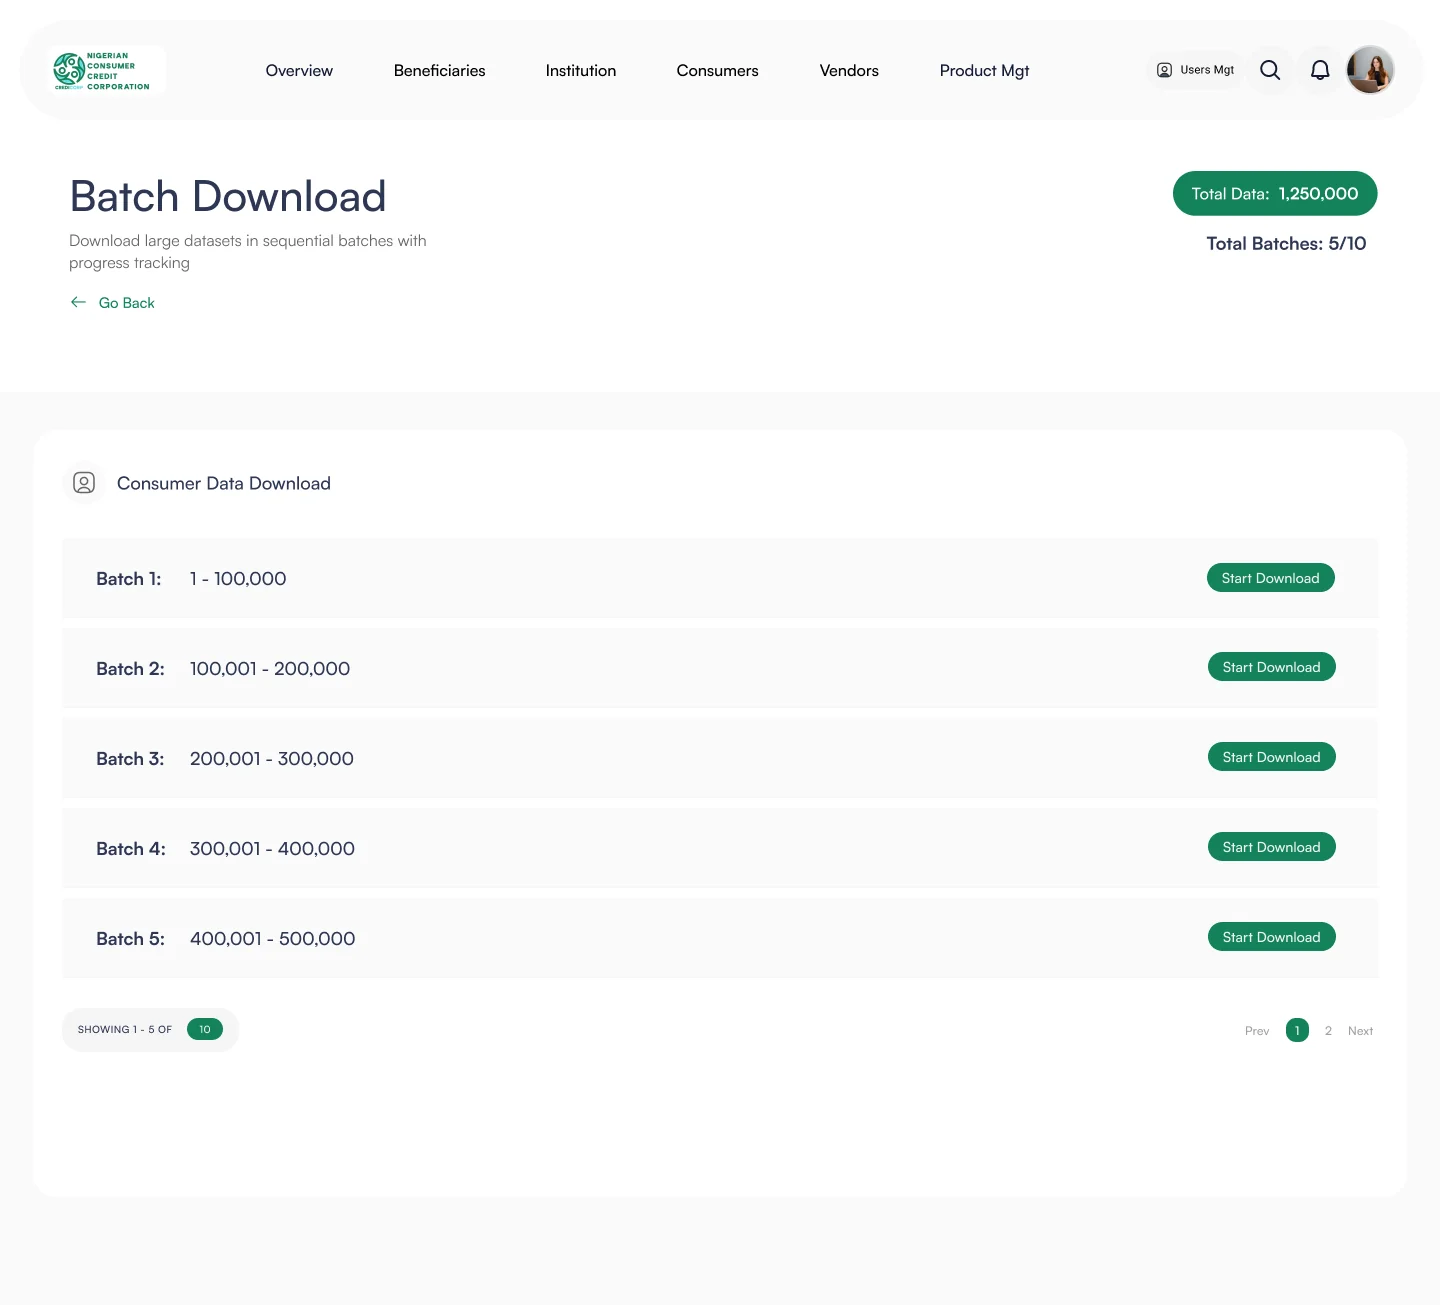
The interface uses a restrained visual system so the data remains the primary signal. The repeated header/navigation, tabs, date controls, export actions, tables, cards and profile layouts create familiarity as users move between modules.
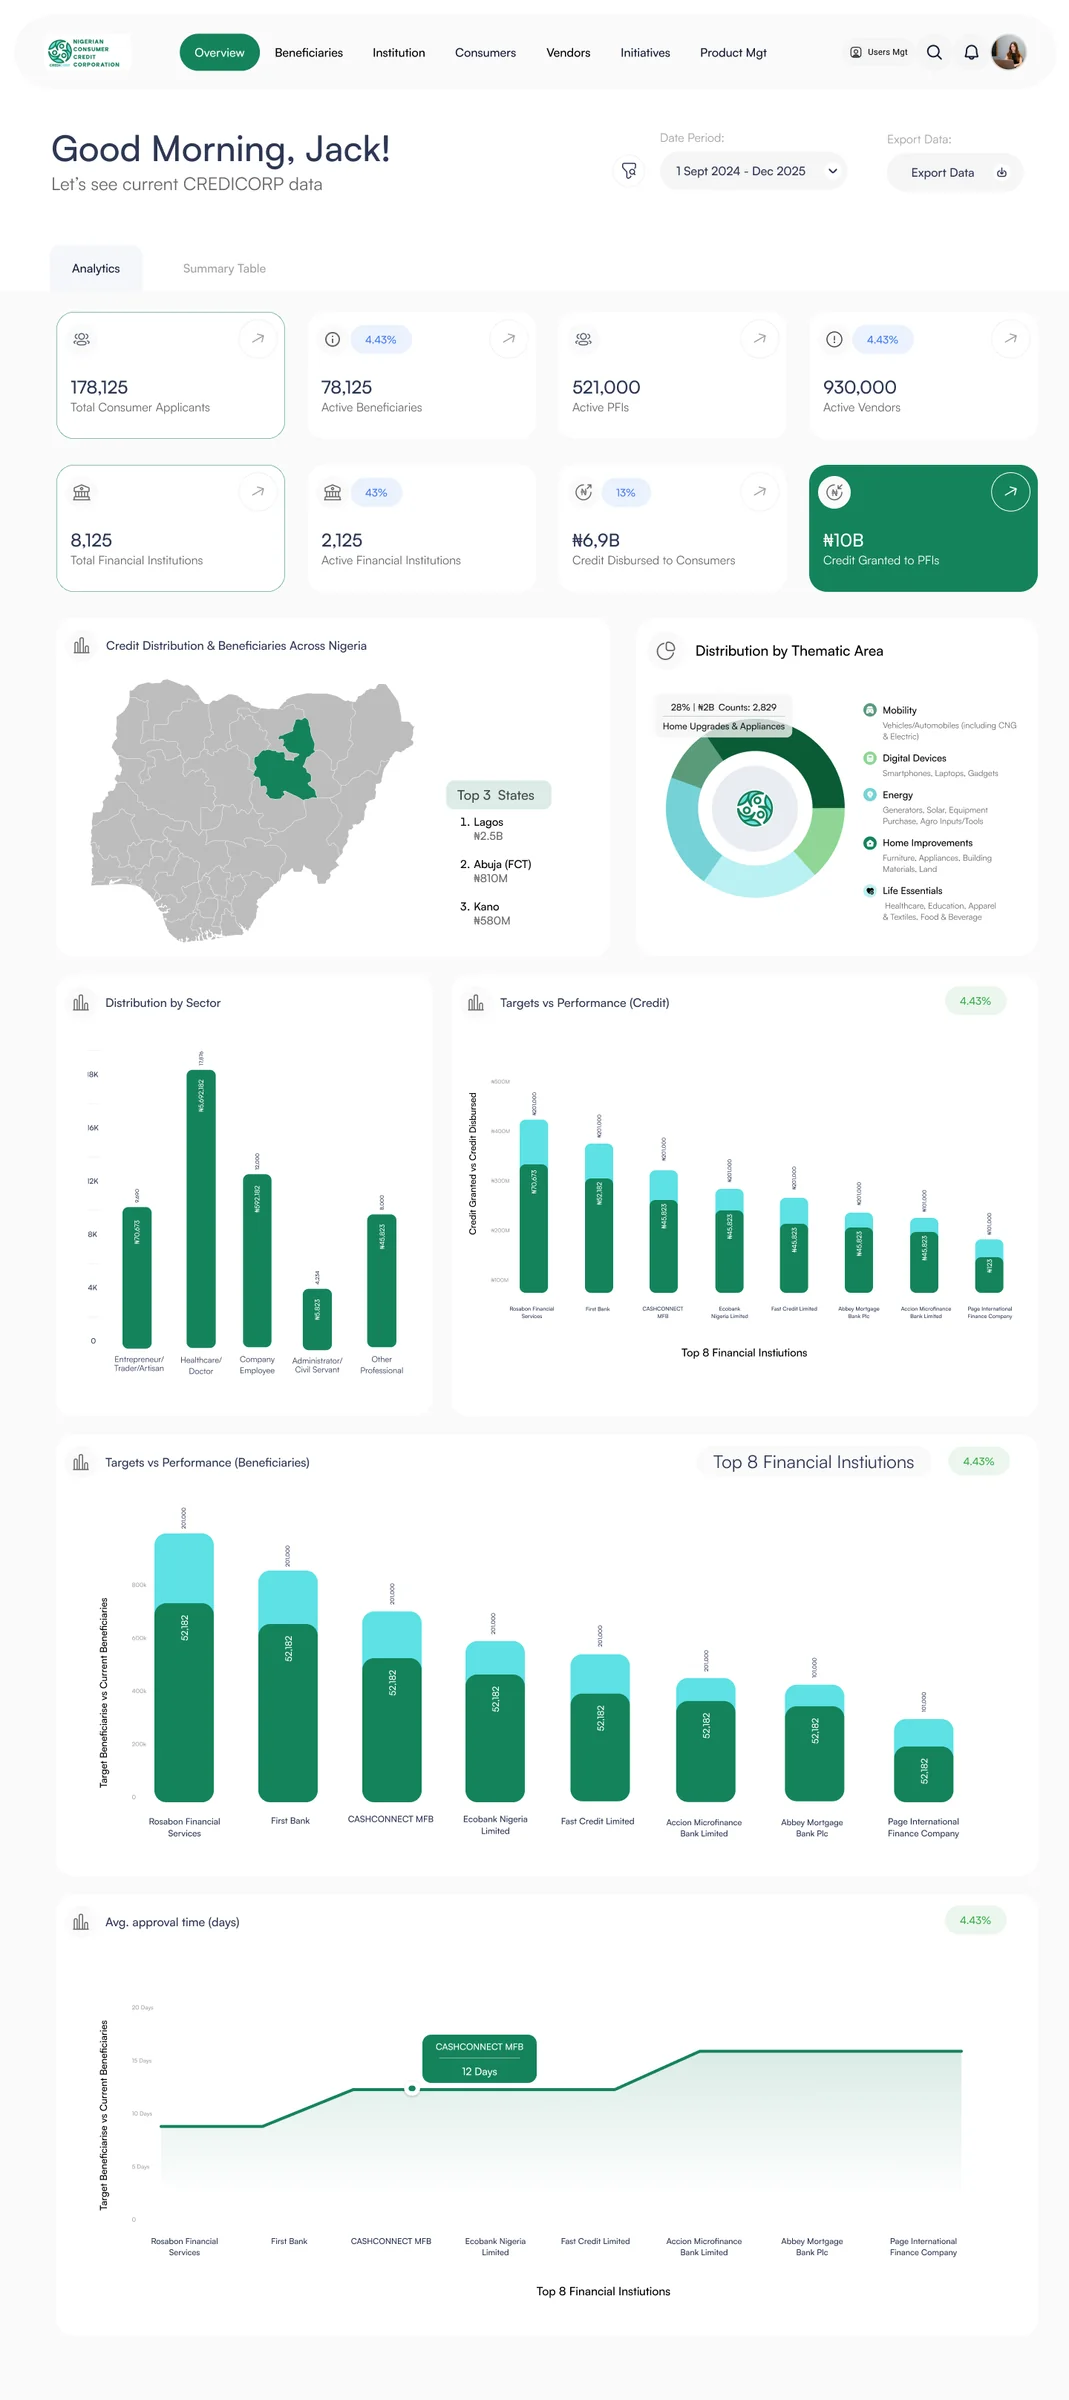
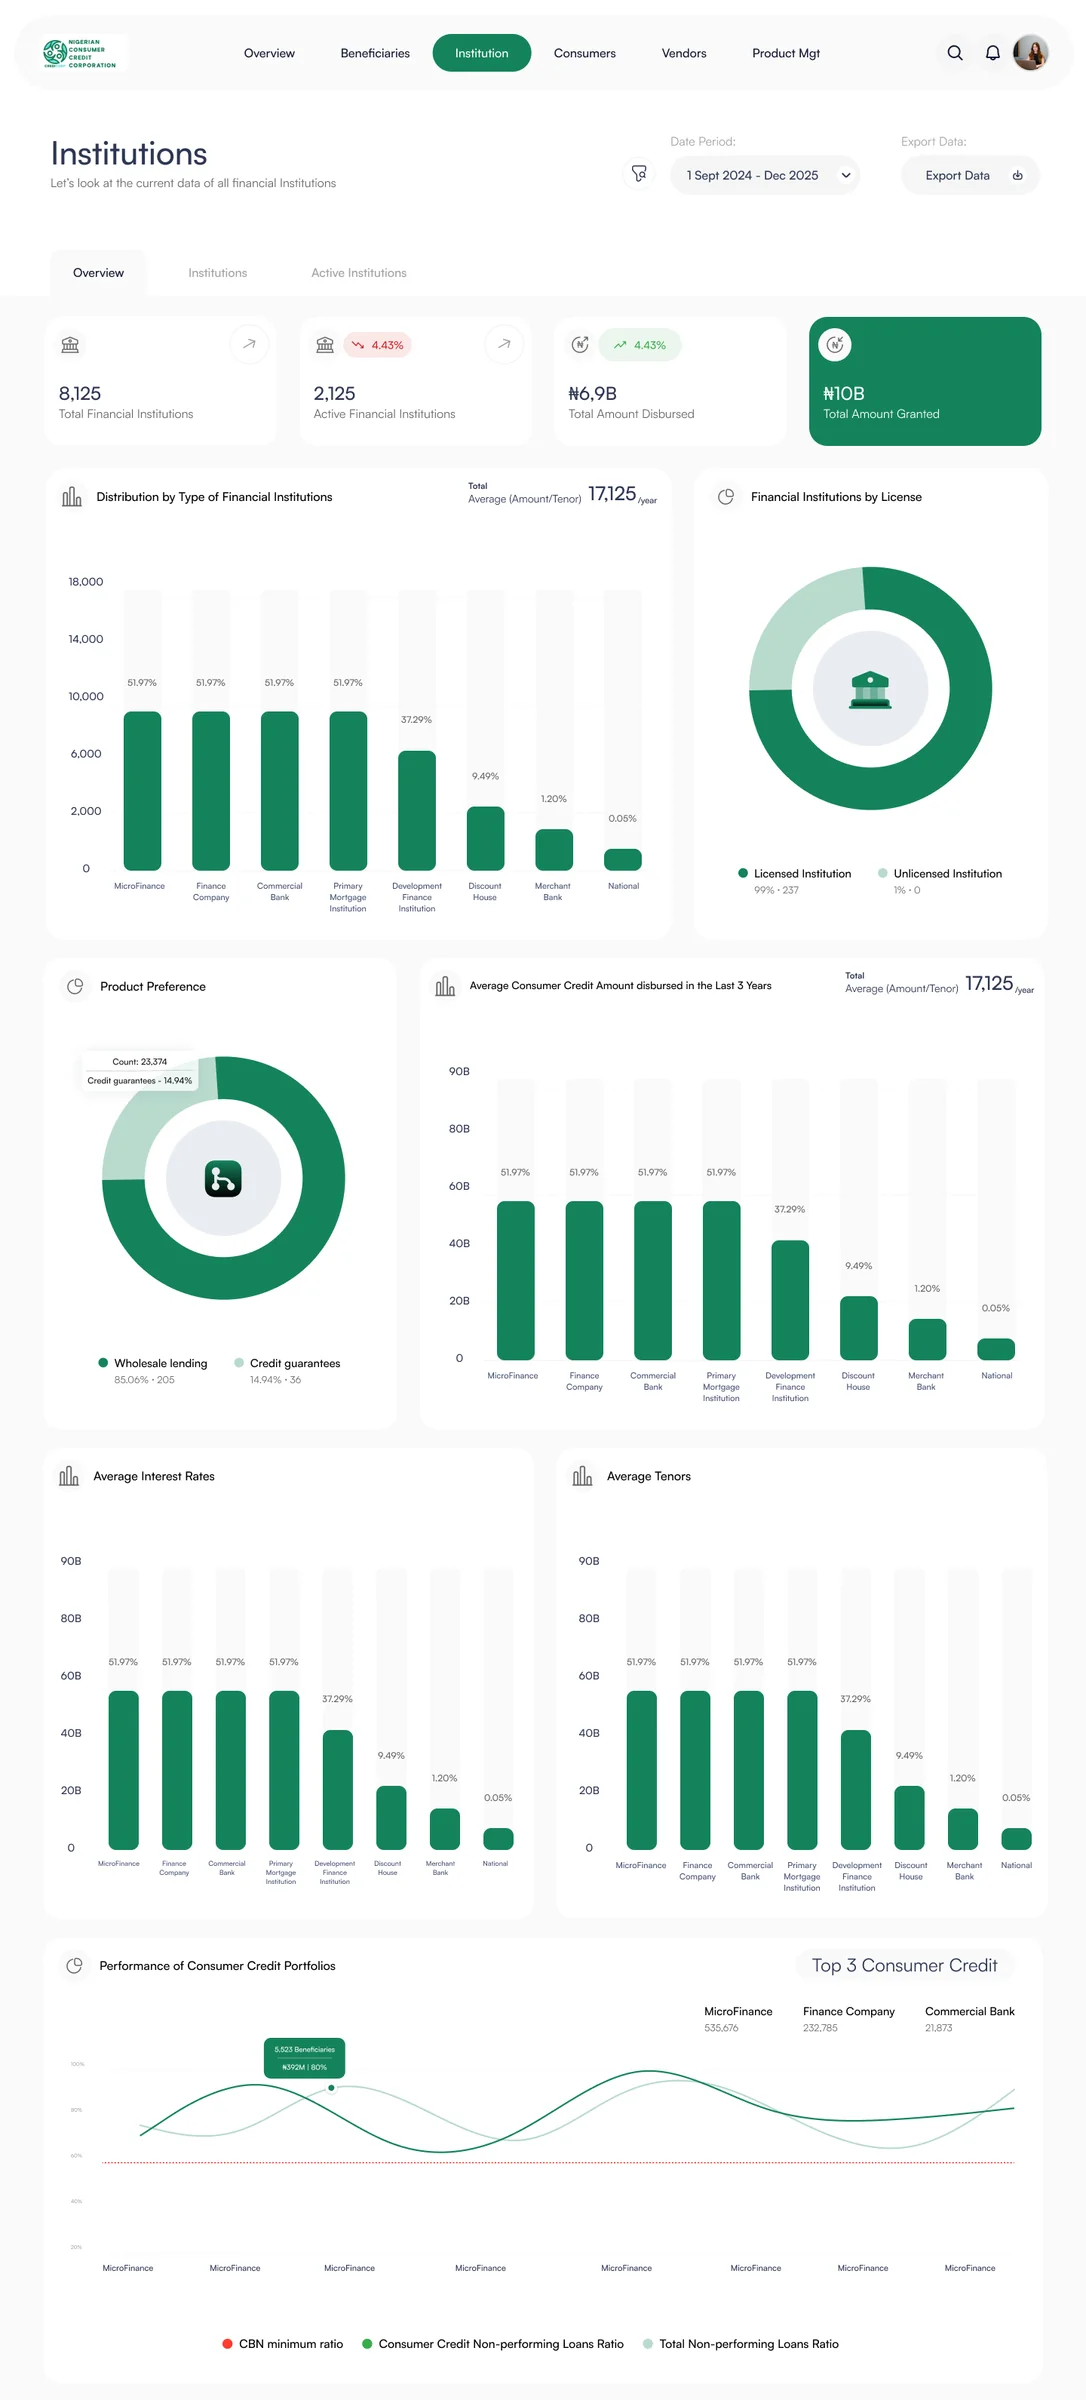
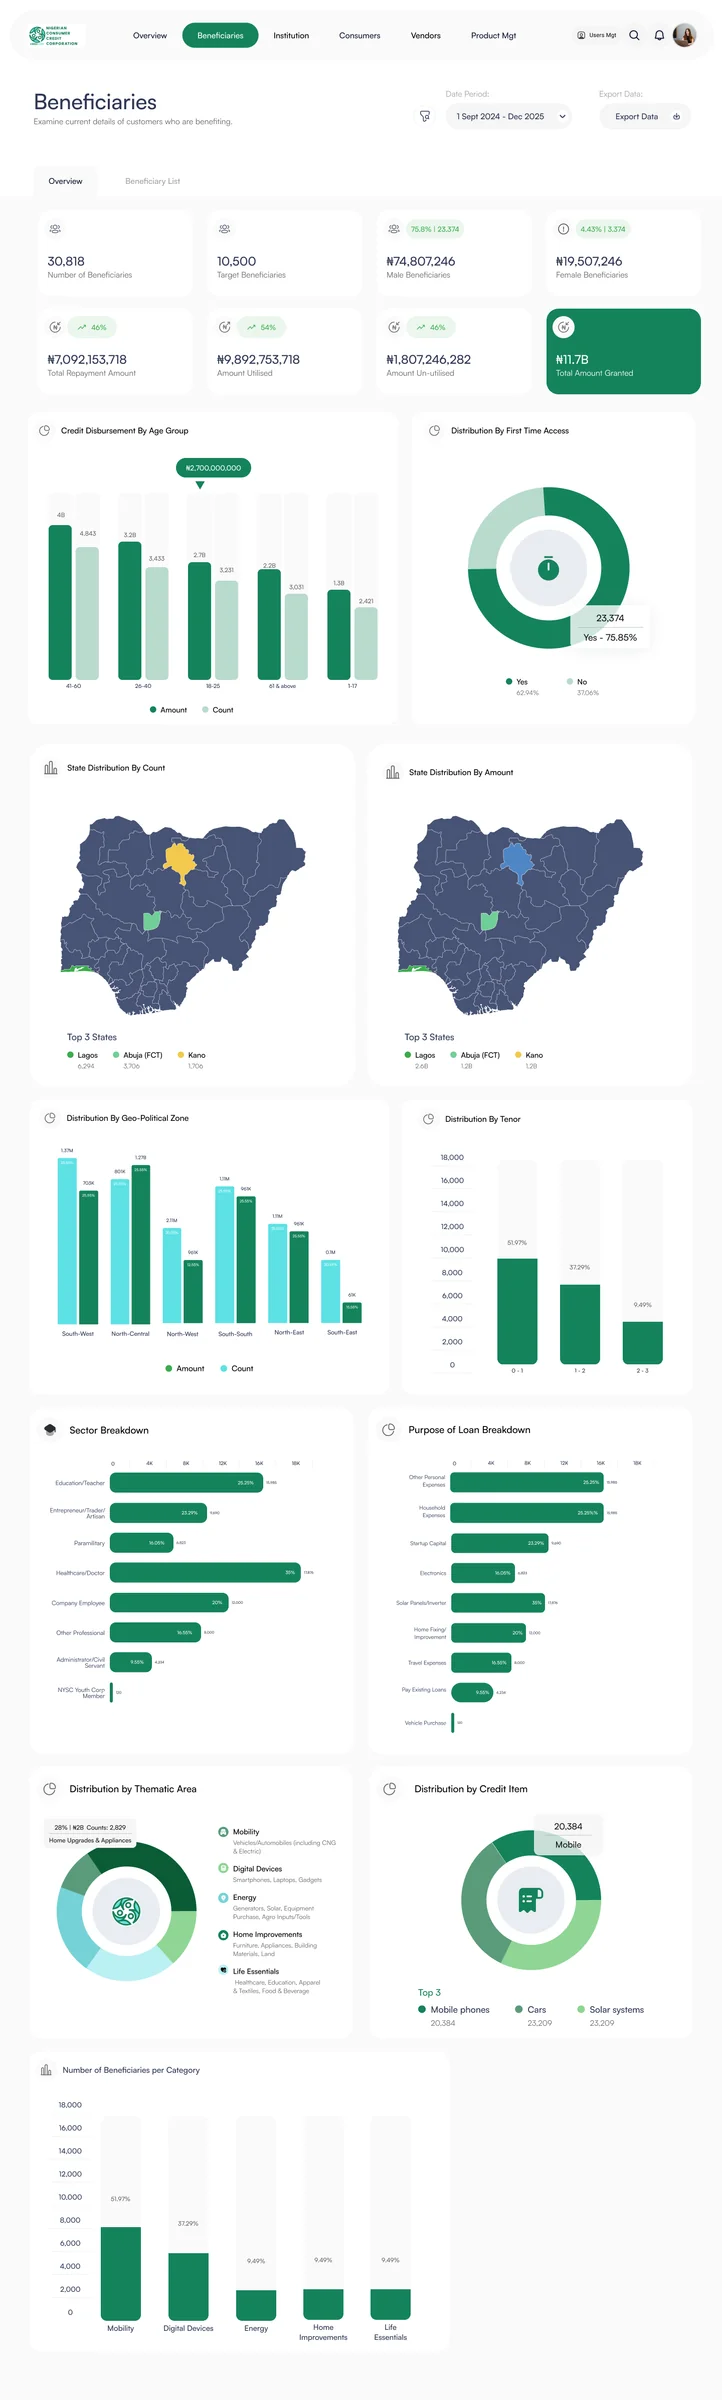
Analytics and overview cards create a high-level entry point before users move into lists and records.
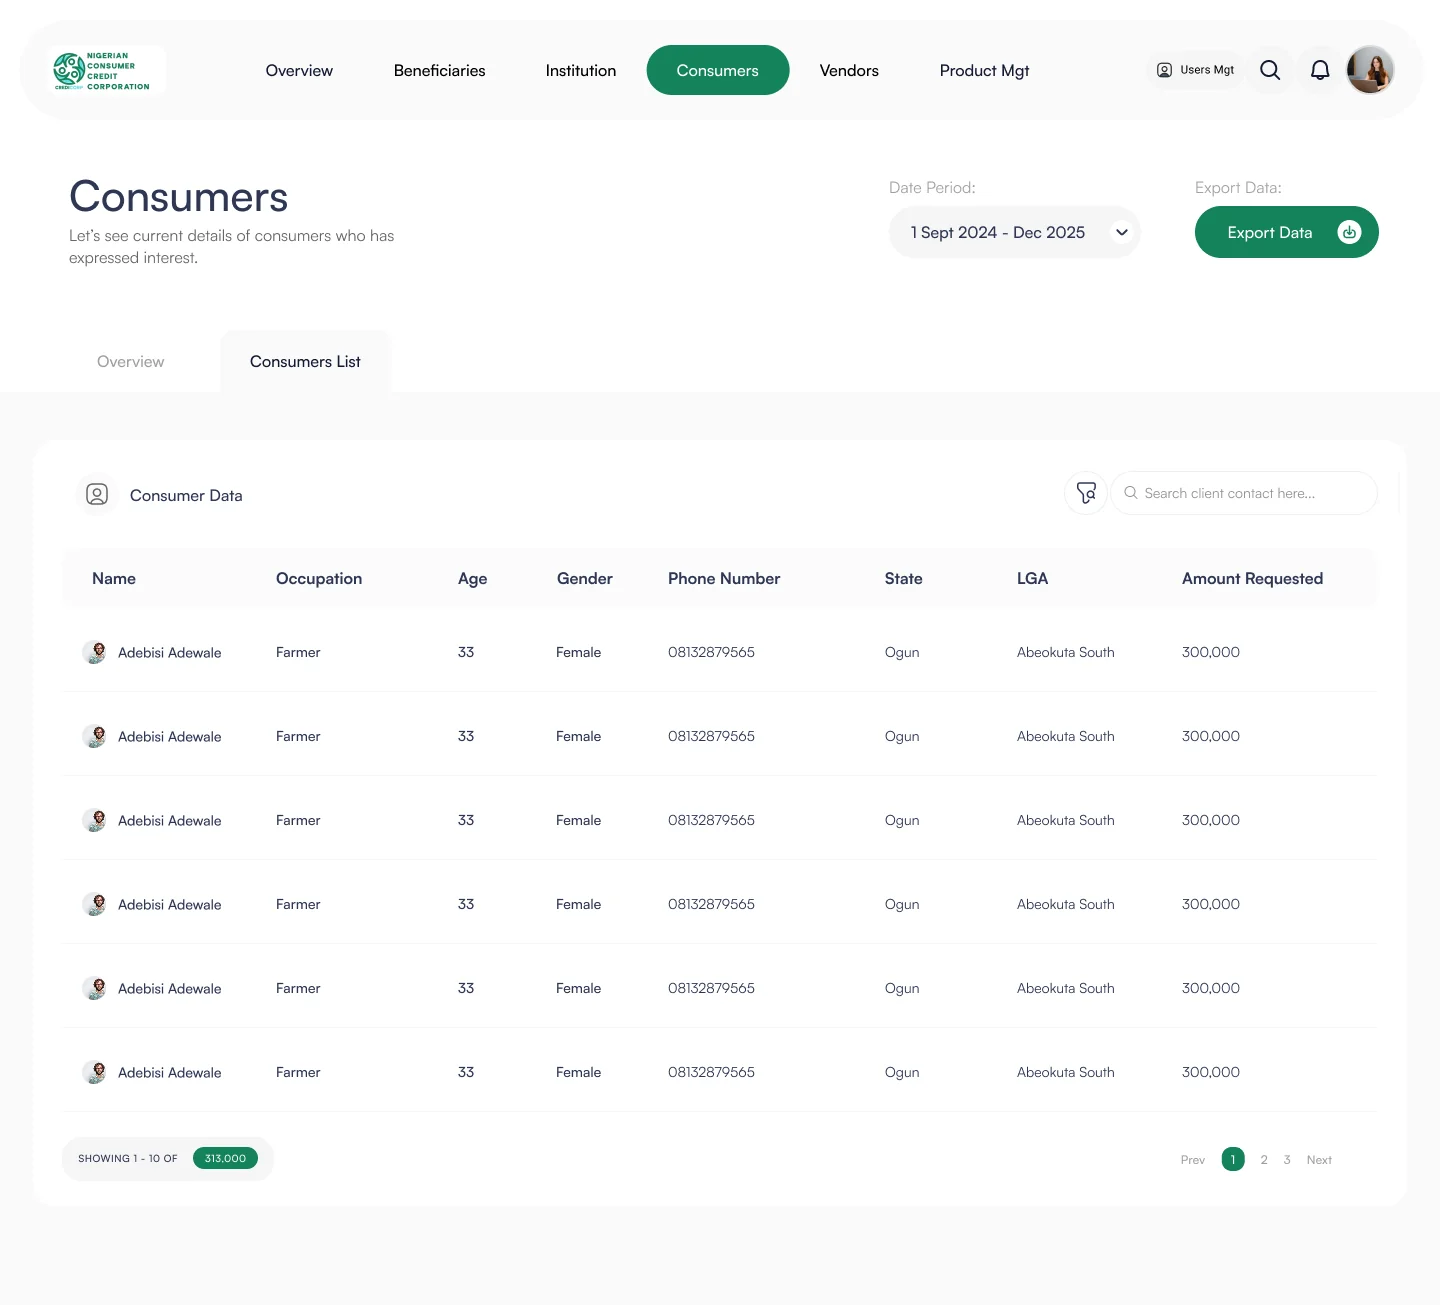
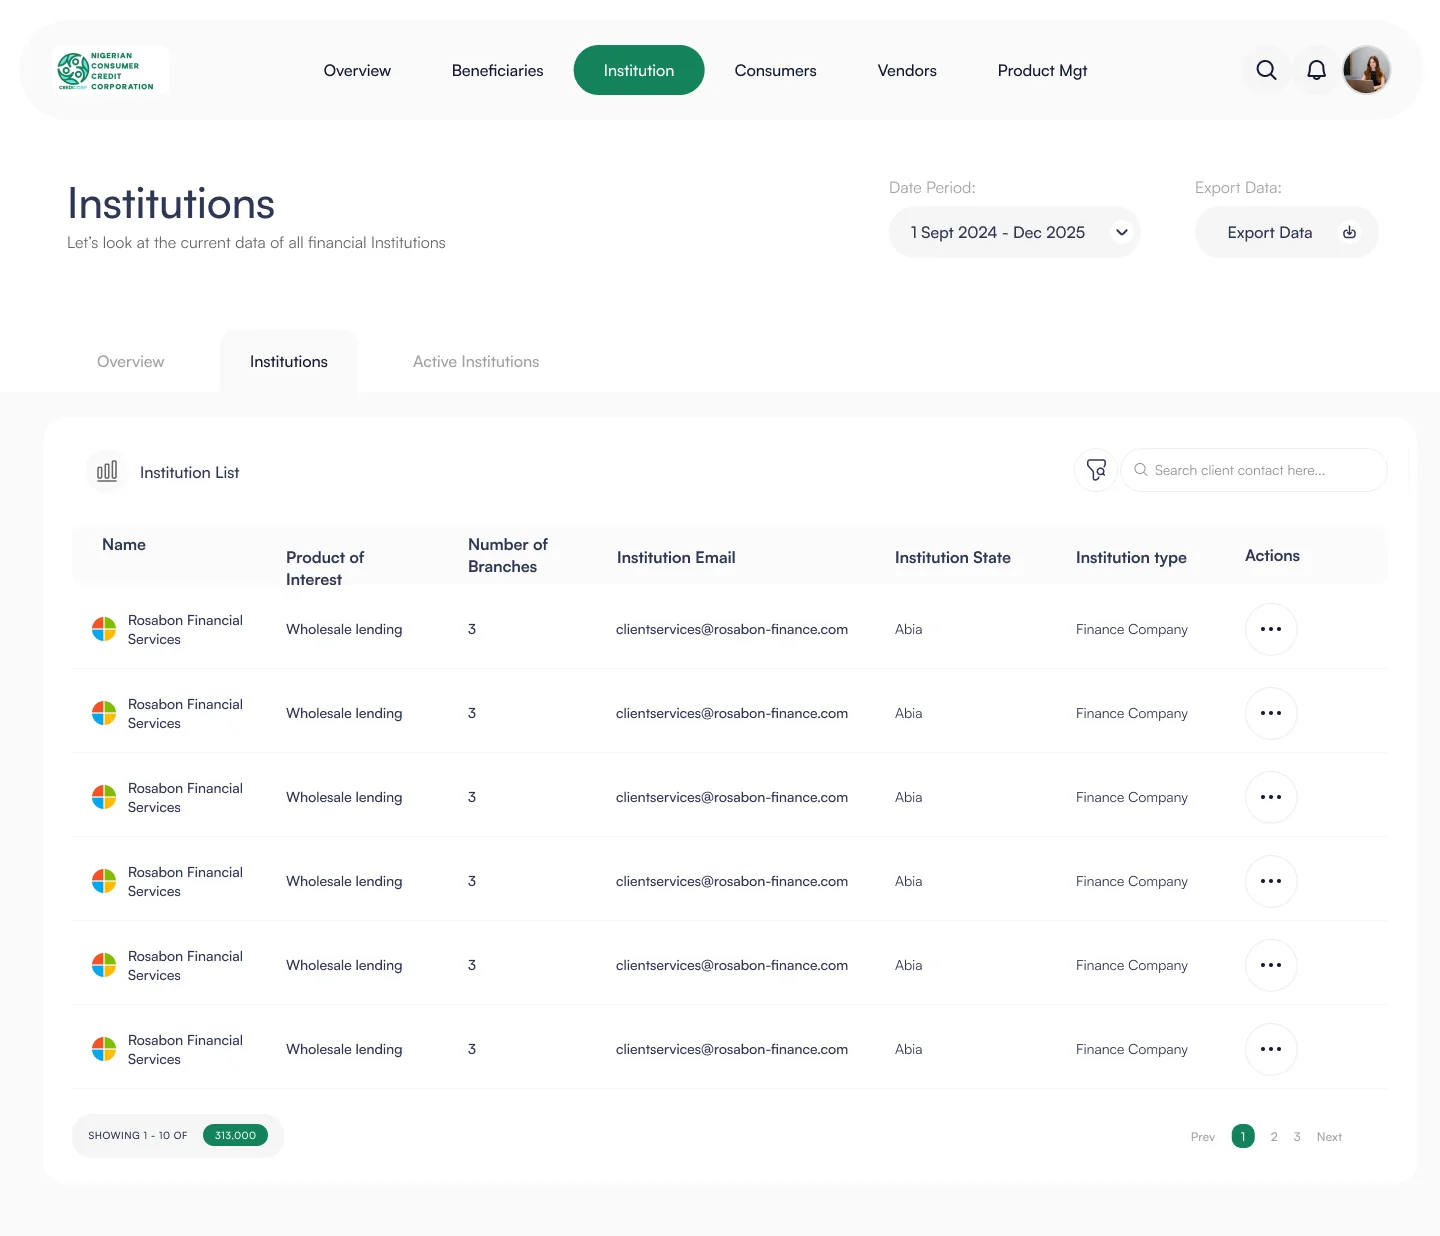
Column structure, spacing and compact controls keep dense records readable without turning the page into a wall of text.
Detailed vendor and record views preserve the same information architecture users encounter in the list experience.
Date ranges, filtering and batch download are treated as operational tools rather than hidden utilities.
From overview to operational detail
The gallery deliberately alternates full-width product views with focused crops and detail screens so the case study reads like a product walkthrough rather than a dump of screenshots.
A calmer interface for a data-heavy product.
The resulting interface gives the portal a clear visual grammar across dashboards, tables, filters, profiles and analytics. That consistency matters in enterprise products because users spend less time re-learning the interface as they move between operational modules.
The supplied screens demonstrate a product that can move from overview → list → record → action while keeping the same underlying structure.
Summary, records and actions have distinct visual roles.
Tables, tabs, cards, filters and profiles form a coherent system.
Review, filtering, analytics and data export remain easy to find.